5 Additional Results
5.1 Distribution of heterogeneity across studies
Figure 5.1 shows that heterogeneity is not equally distributed along studies. In fact, most studies (84.9% GEO, 74.7% ARCHS4) contain no samples with detected heterogeneity and only a small percentage (5.7% GEO, 7.3% ARCHS4) contain “severely heterogeneous” samples.
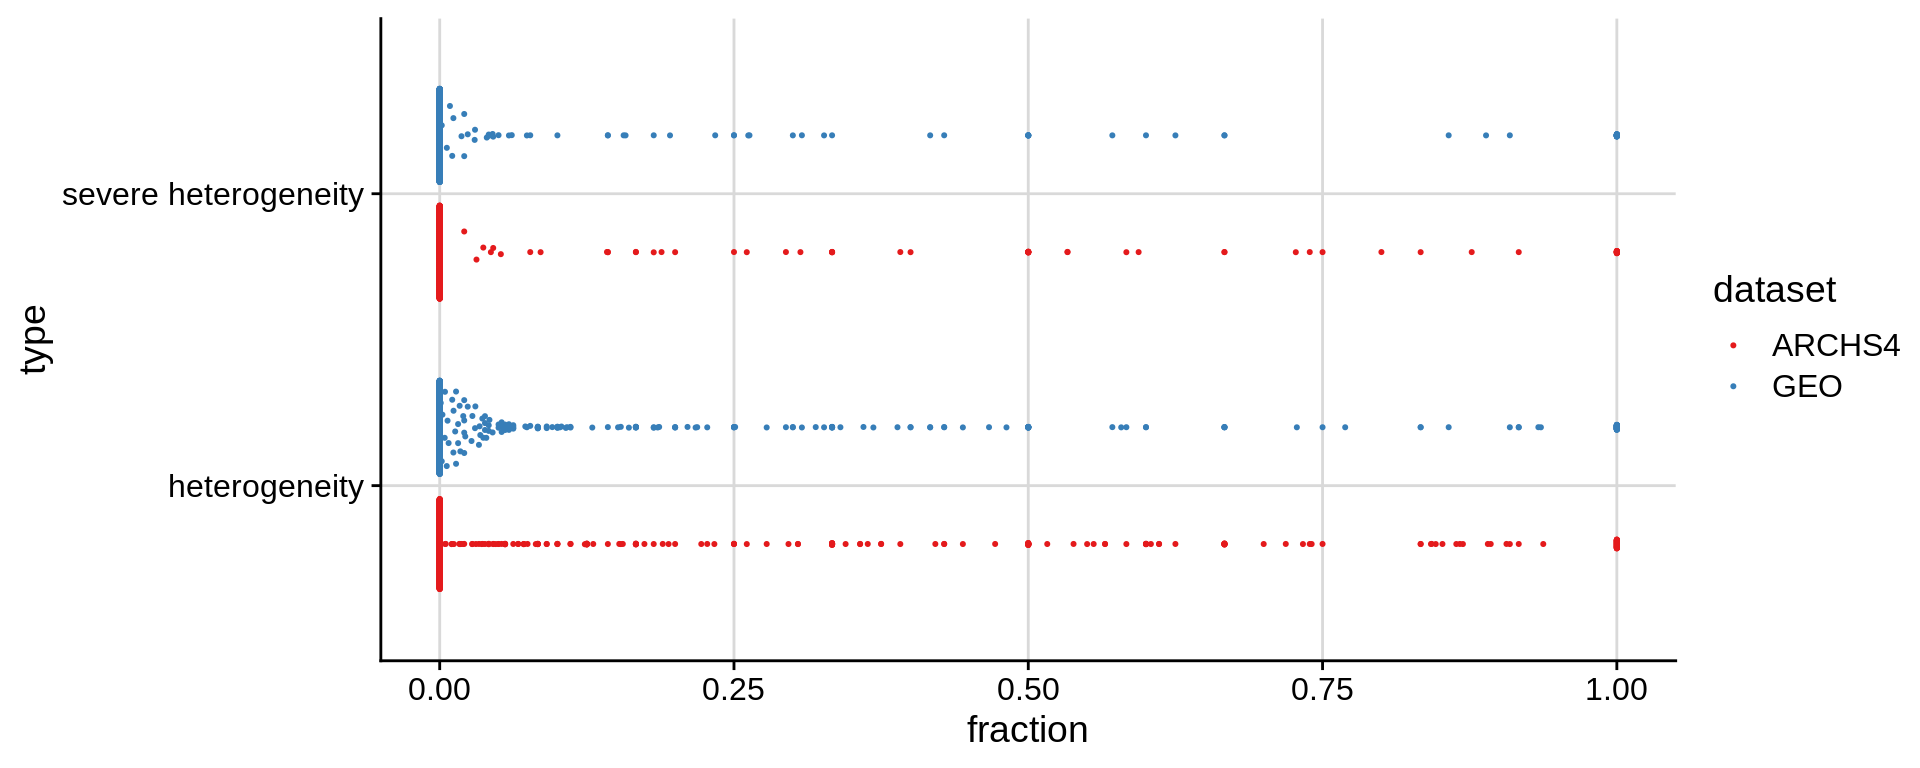
Figure 5.1: Beeswarm plot depicting the fraction of heterogeneous samples and severely heterogeneous samples for each study.
5.2 Heterogeneity along time
Next, we were interested if heterogeneity increases over time. Figure 5.2 shows the heterogeneity fractions per year and tissue. While there is some variance between years, there appears to be no clear trend over time.
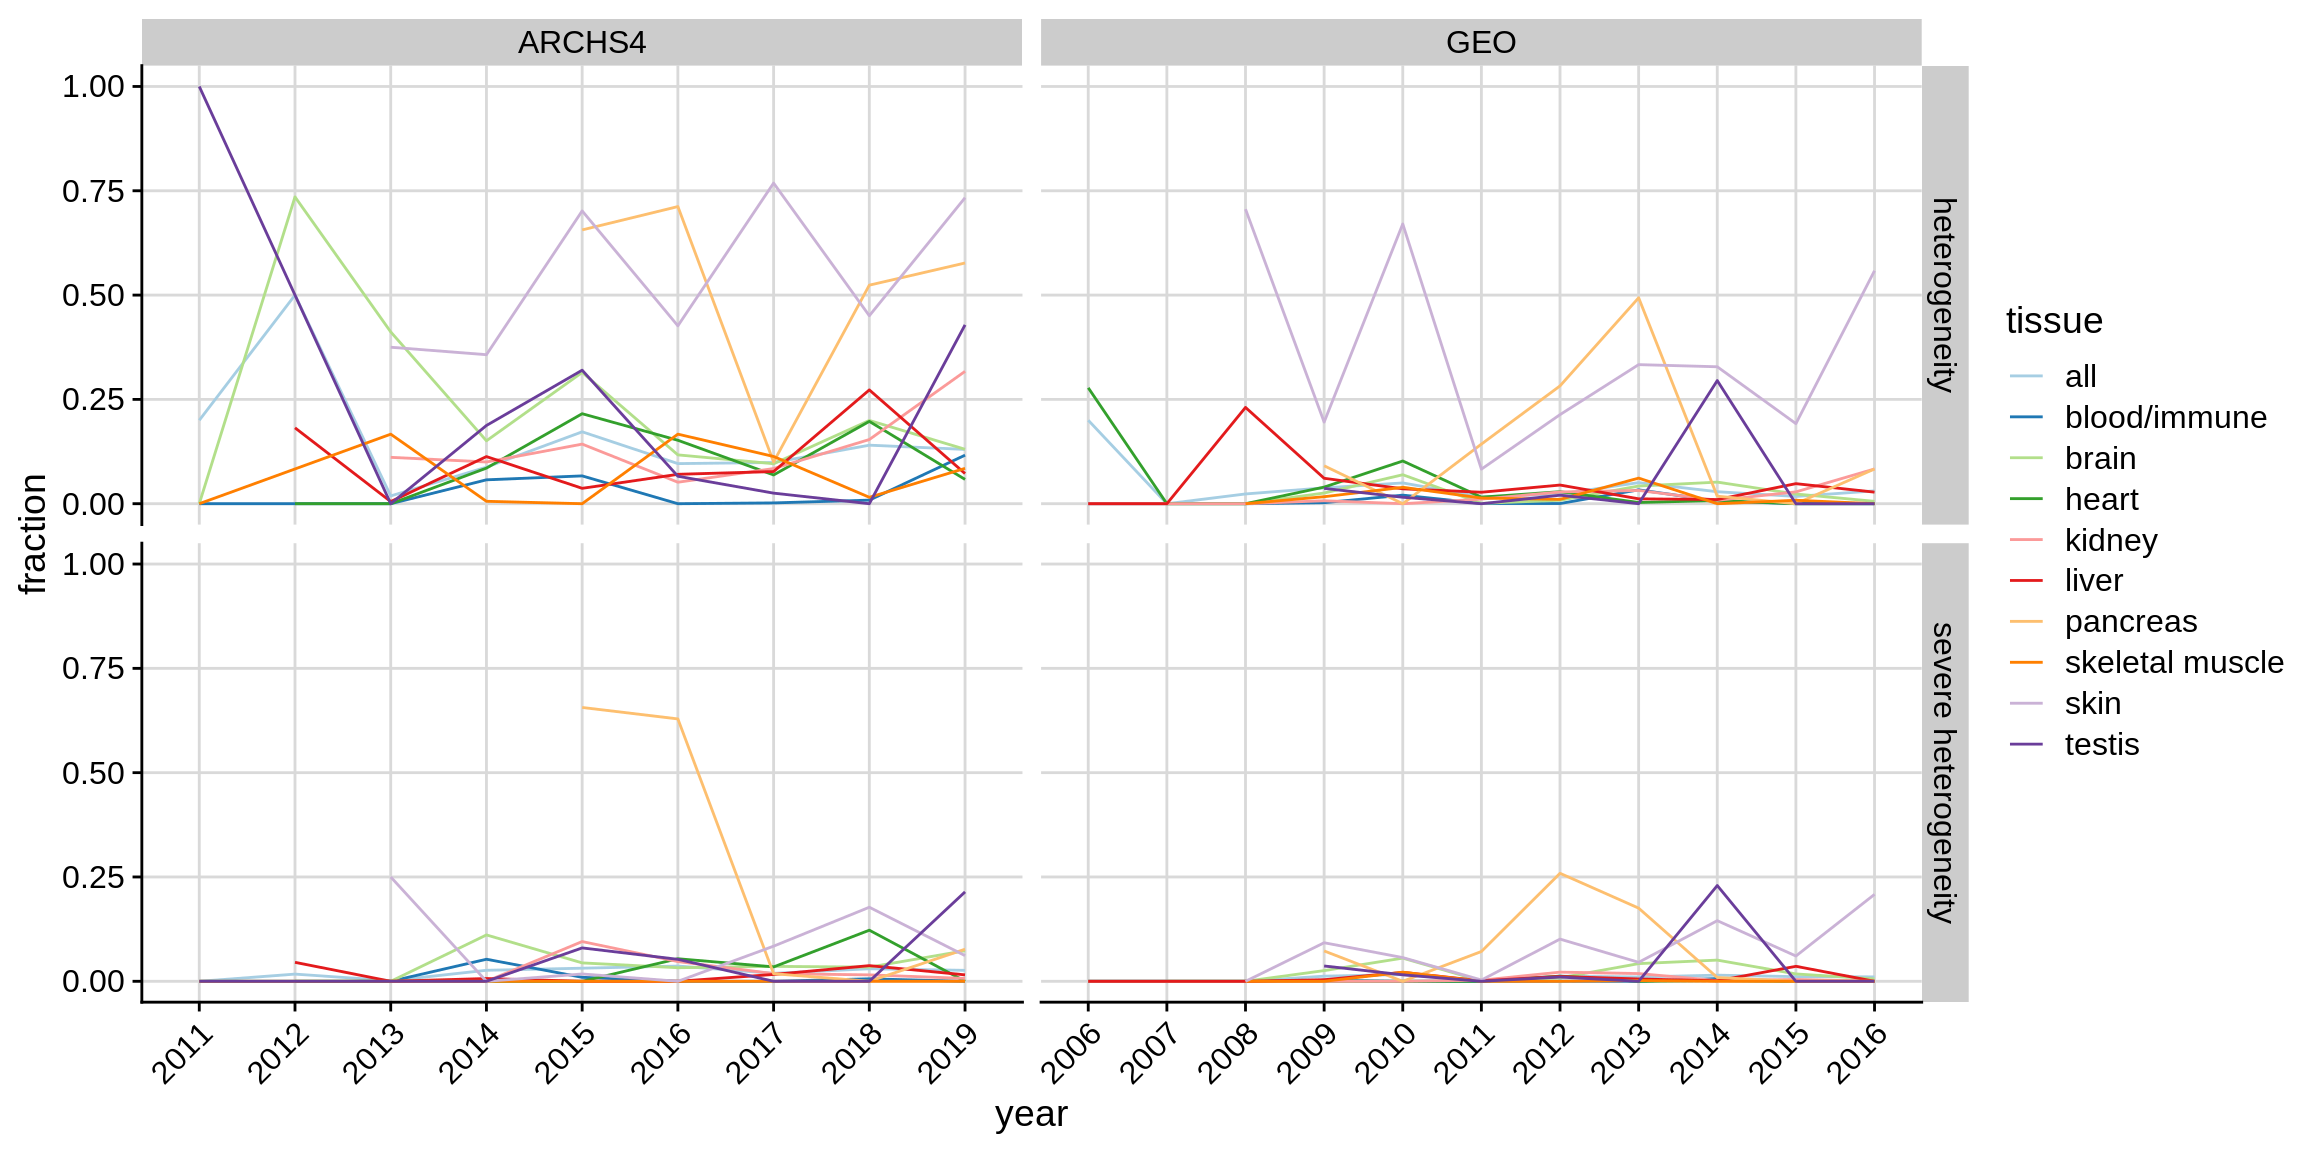
Figure 5.2: Fractions of heterogeneous and severely heterogeneous samples by year.
To formally test the hypothesis that heterogeneity is associated with a time variable, we fitted a linear model (heterogeneity ~ year + tissue)
and checked the year coefficient (table 5.1). There appears to be no significant association of time with heterogeneity.
| dataset | type | slope | p-value |
|---|---|---|---|
| ARCHS4 | heterogeneity | -0.0048787 | 0.6042316 |
| ARCHS4 | severe heterogeneity | -0.0012819 | 0.8091536 |
| GEO | heterogeneity | -0.0031032 | 0.4313845 |
| GEO | severe heterogeneity | 0.0015394 | 0.3646752 |