4 Testing for tissue heterogeneity
4.1 Tissue signatures
In section 2, we identified a set of 9 reference signatures (table 4.1) which unambiguously identify their corresponding tissue across platforms and species. In addition to that, we use 120 tissue signatures from the BioQC publication, which we refer to as query signatures.
| Reference Signature | Tissue | NA |
|---|---|---|
| GTEX_Blood | blood/immune | blood |
| GTEX_Blood | blood/immune | white blood cells |
| GTEX_Blood | blood/immune | pbmc |
| GTEX_Brain | brain | brain |
| GTEX_Brain | brain | cerebellum |
| GTEX_Brain | brain | cortex |
| GTEX_Brain | brain | frontal cortex |
| GTEX_Brain | brain | prefrontal cortex |
| GTEX_Brain | brain | hippocampus |
| GTEX_Brain | brain | hypothalamus |
| GTEX_Heart | heart | heart |
| GTEX_Kidney | kidney | kidney |
| GTEX_Liver | liver | liver |
| GTEX_Liver | liver | hepatocyte |
| GTEX_Muscle_Skeletal | skeletal muscle | skeletal muscle |
| GTEX_Pancreas | pancreas | pancreas |
| GTEX_Skin | skin | skin |
| GTEX_Testis | testis | testis |
4.2 Testing samples for heterogeneity
We tested for enrichment of 120 selected signatures provided by BioQC (query signatures) and the 9 reference signatures generated by us on all 76576 selected samples resulting in a list of 9878304 (sample, signature, pvalue) pairs.
Our intention is to identify samples that show tissue heterogeneity, i.e. unintentional profiling of cells of other origin than the target tissue of profiling. We classify samples into heterogeneous and not heterogeneous. We call a classification true-positive if the given sample is classified as heterogeneous and the sample indeed contains cells different from the annotated tissues. Analogous, we call a classification false-positive if the given sample is classified as heterogeneous but in reality only contains cells from the annotated tissue.
Naively, we could label a sample as heterogeneous, if a signature unrelated to the annotated tissue exceeds a certain score. The problem with this approach is, that some signatures overlap; the resulting scores are therefore correlated and will lead to false-positives. One cannot simply solve this problem by excluding genes that are members of multiple signatures, as it is easily possible to build two (in fact many) distinct, non-overlapping signatures matching the same tissue, due to gene-gene correlation.
In section 2 we have created and validated
reference signatures for 9 tissues. Even though we have demonstrated that
each signature unambiguously identifies its corresponding tissue (i.e. scores
highest), the signatures could still be correlated. Some of them in fact are,
e.g. cardiac muscle and skeletal muscle (see figure
4.1). Moreover, we lack sufficient data to perform an
independent-sample validation on the signatures provided by BioQC.
Therefore, to avoid false-positives, for each tissue, we exclude all signature
that are positively correlated with the reference signature. This approach is
more formally described in the following:
A given sample \(s\) annotated as tissue \(t\) is tested for enrichment with signature \(k_{\text{query}}\) resulting in a p-value \(p_{\text{query}}\). Let \(k_{\text{ref}}\) be the reference signature associated with tissue \(t\) and \(p_{\text{ref}}\) the p-value of testing \(s\) for enrichment of \(k_{\text{ref}}\). Let \(\tau\) be a certain false discovery rate (FDR)-threshold (0.01 in this study).
- If the Benjamini-Hochberg (BH)-adjusted \(p_{\text{query}} \ge \tau\), we assume that \(s\) is not heterogeneous; else continue.
- We fit a robust linear model using
rlmfrom theRMASSpackage of \(|log10(p_{\text{query}})|\) against \(|log10(p_{\text{ref}})|\) for all samples annotated as \(t\). - If the slope of the linear model is \(\ge 0.01\), we exclude the pair of signatures from the results. If the slope is \(< 0.01\) and the FDR-adjusted \(p_{\text{query}} < \tau\), we consider the sample as heterogeneous. Tissue pairs for which signatures are excluded are marked as such in the results.
- We define heterogeneity as severe, if additionally \(p_{\text{ref}} \ge\) 0.05.
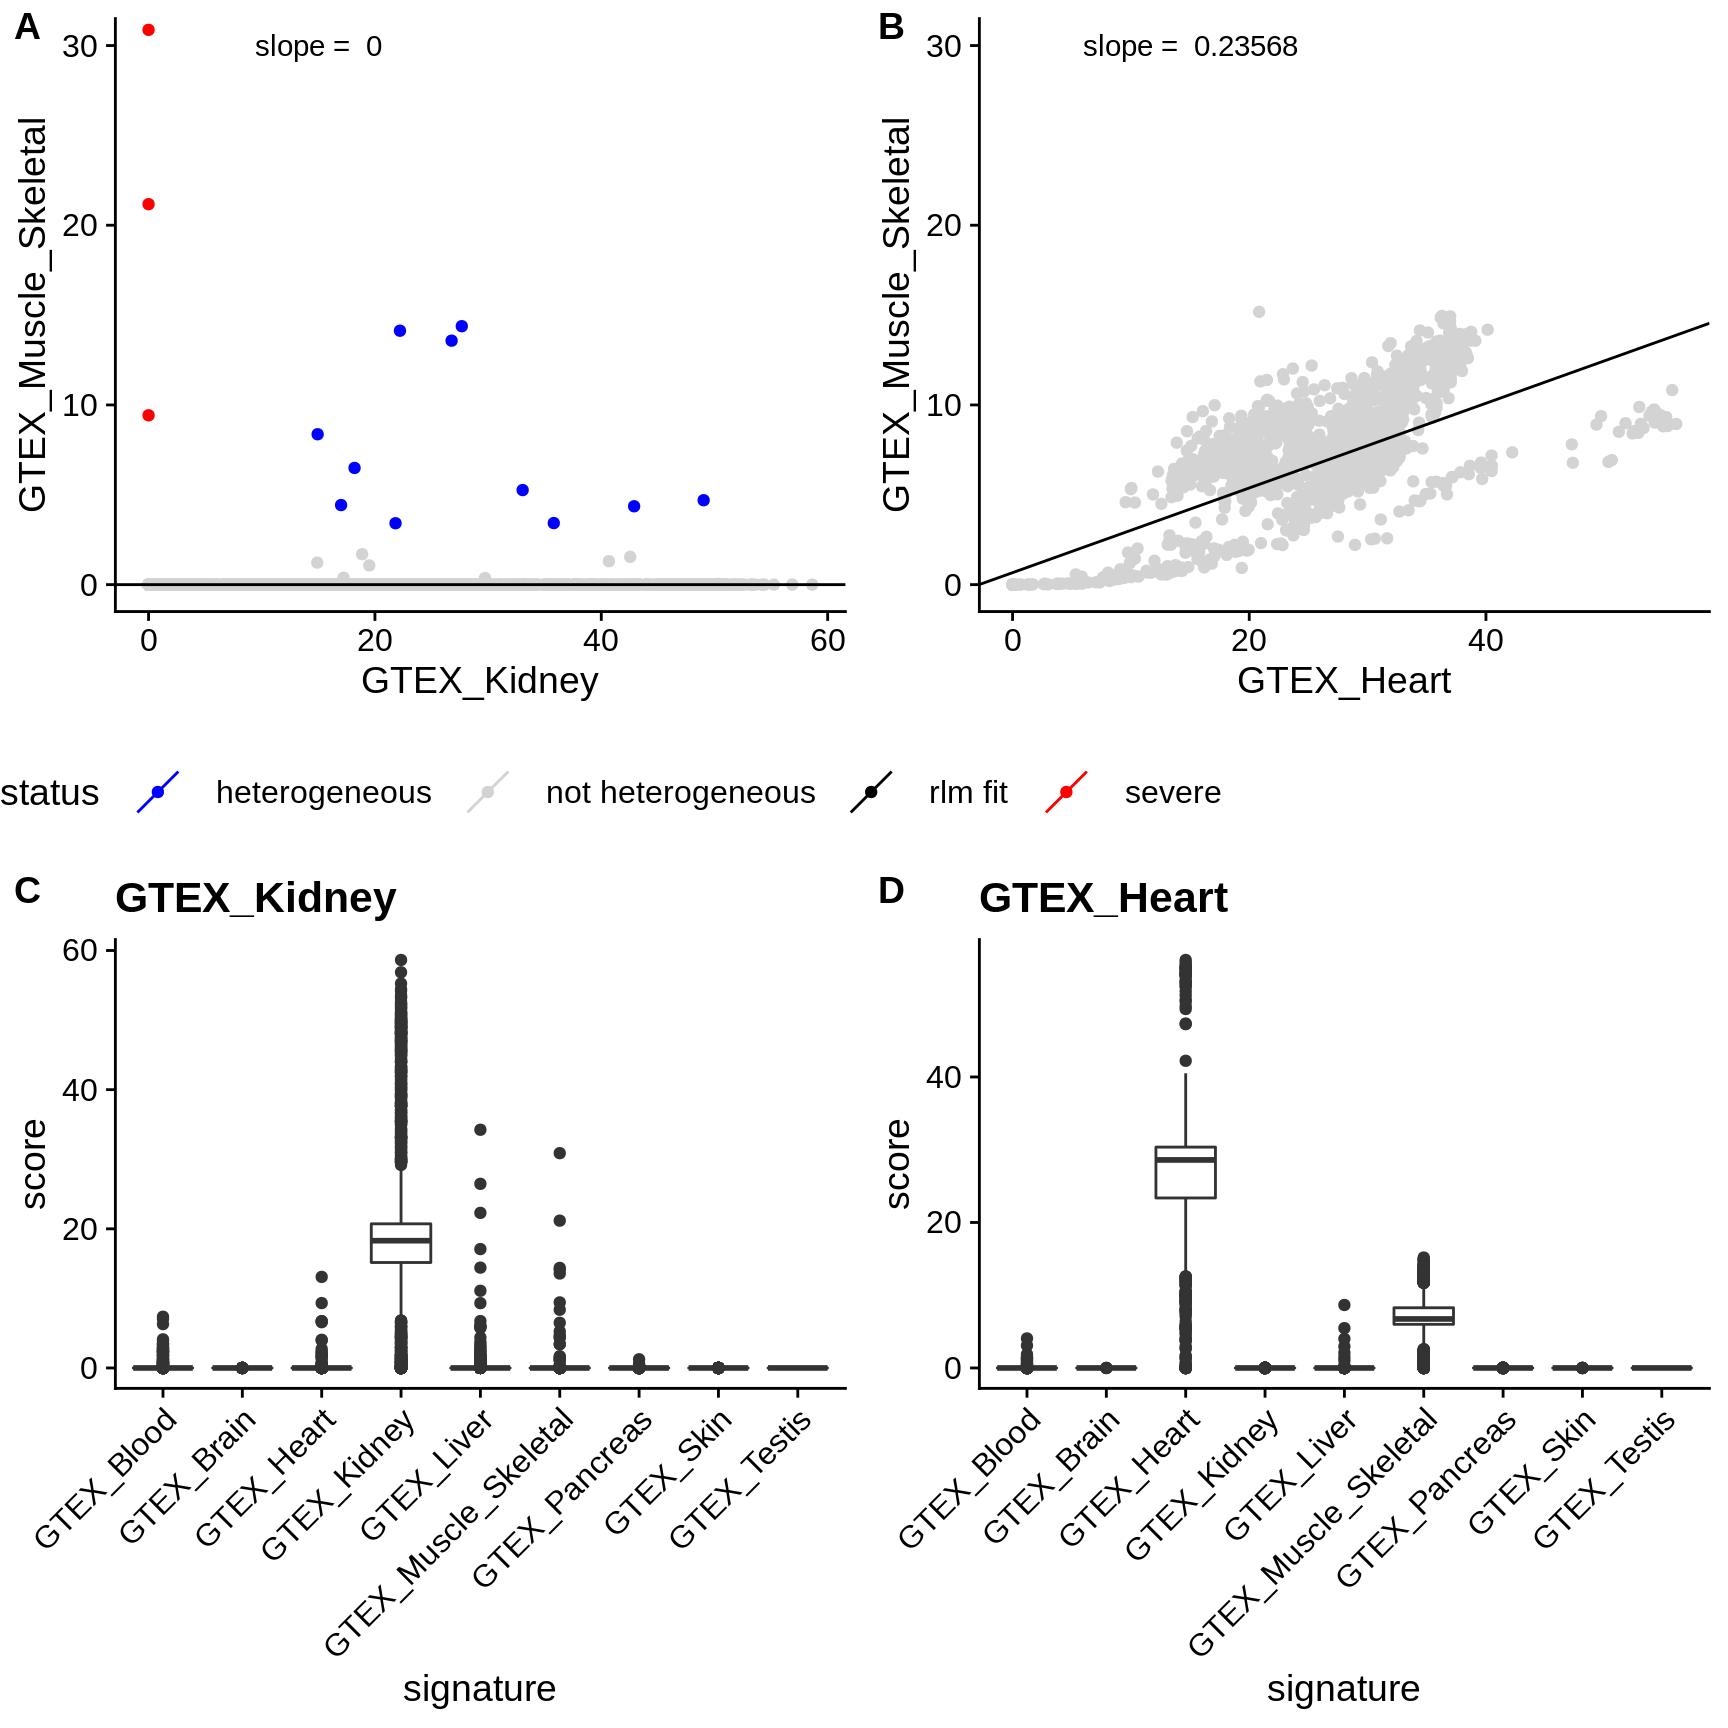
Figure 4.1: Examples of signature correlation. Panels A-B: scatterplot of the signature scores (y-axis) against the scores of a reference signature (x-axis). The black line indicates the model fitted to the data. Points are colored according to the called heterogeneity status. (A) Skeletal muscle scores of kidney samples against scores of the kidney signature. The samples are not correlated, however some outliers are detected which are samples likely containing muscle cells. (B) Skeletal muscle scores of cardiac muscle samples against skeletal muscle scores. The scores are highly correlated. While most of the points exceed the FDR threshold, they will not be classified as heterogeneous since the signatures are correlated. Panels C and D show the boxplots of the scores of various signatures on kidney and heart samples, respectively.